Benji Jones of Vox.com writes:
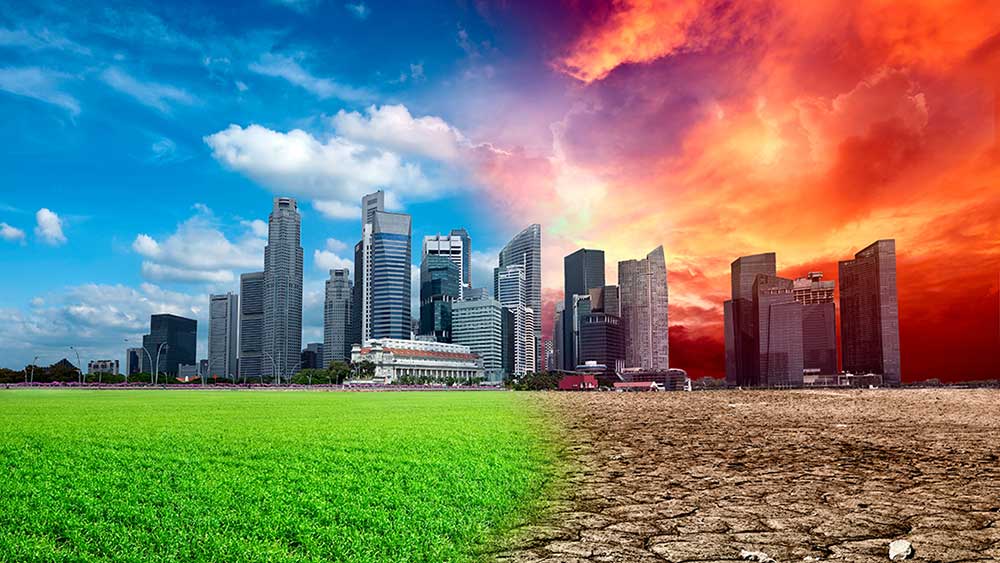
Humans have warmed the planet by an average of 1.2 degrees Celsius since industrialization began in the 19th century...What’s worrying is that Earth will continue to heat up — likely past 1.5 degrees — even if humans slash fossil fuel emissions immediately, according to a landmark UN climate report released this week. So does that mean weather will get worse, too?
With the August 9, 2021 release of the UN Intergovernmental Panel on Climate Change’s (IPCC) dire Climate Change 2021: The Physical Science Basis. Contribution of Working Group I to the Sixth Assessment Report of the Intergovernmental Panel on Climate Change, there is no more room for climate doubt – climate action is necessary now.
And, Yes, global weather patterns and specific events are being altered as a result of human actions. Evidenced by numerous climate catastrophes including the recent record-breaking heatwaves, power outages, floods, and severe wildfires, we need to change many dangerous behaviors to put a stop to the warming and start ameliorating the health of our planet.
Specifically, we must act now to cut carbon pollution in half in the next ten years and eliminate it altogether by 2050 to avoid the worst impacts of climate change.
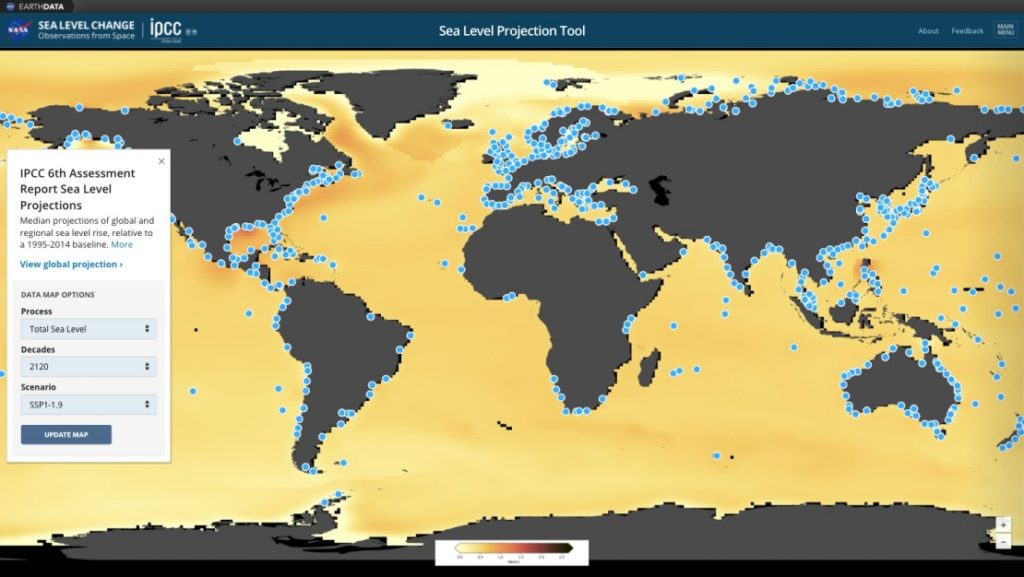
IPCC’s New Interactive Atlas
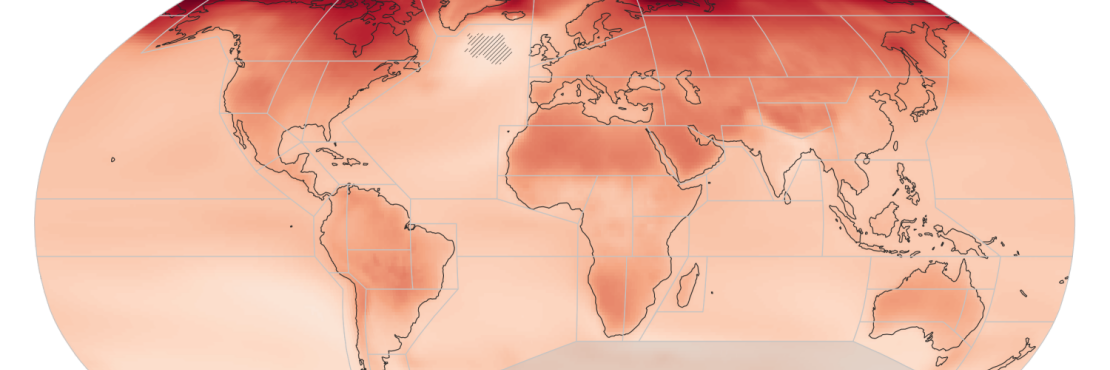
Alongside the UN report, the IPCC launched the interesting and very useful New Interactive Atlas that shows how weather around the world will change under different greenhouse gas emissions scenarios. The map is exactly the specific type of visual tool that we can use to inform people regionally across the globe.
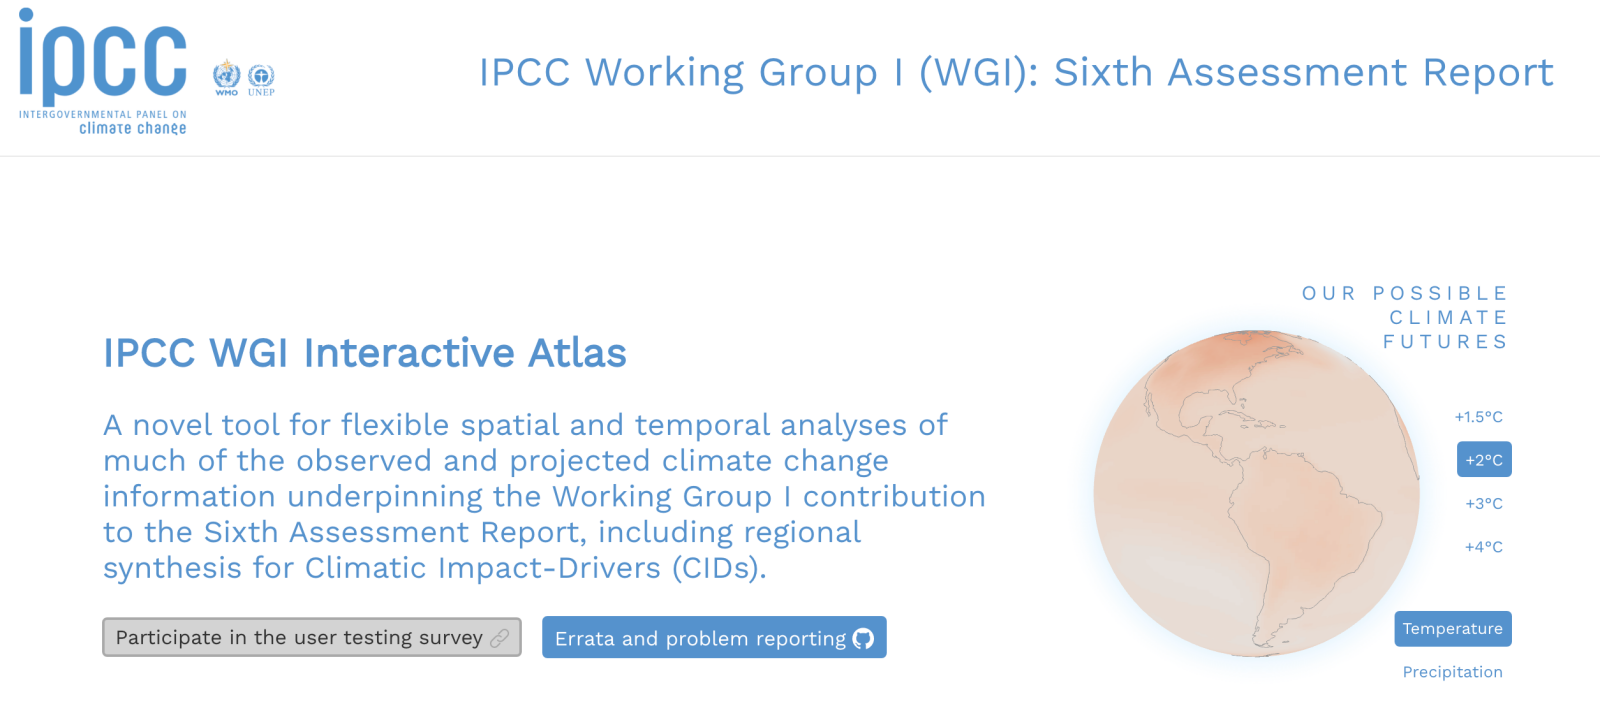
Image: IPCC
IPCC’s New Interactive Atlas includes an Interactive Atlas Guided Tour showing you how to: Filter and select among the different datasets included; Choose different data visualisations and summary statistics; and Download and share the data displayed. The Interactive Atlas projects regional temperature, rainfall, snowfall, and sea level rise. Powered by the same models that produced data for the report, it represents a wide array of climate science. You can also try out additional features of its side-by-side function, which shows two different climate scenarios next to each other on a map – plus many more.
“The report from the United Nations Intergovernmental Panel on Climate Change does not mince words: The evidence is “unequivocal” that these unprecedented extreme weather disasters are tied to carbon emissions from fossil fuel burning and other human activities. This means that yes, dangerous climate change has arrived and at this point it’s simply a matter of how bad we’re willing to let it get.” ~ Michael E. Mann
Getting back to this latest IPCC report, Michael E. Mann, a professor of atmospheric science and director of the Earth System Science Center at Penn State University, recently contributed the Opinion piece “You should be concerned about climate change but big oil should be terrified” in The Boston Globe (updated with today’s date.) He says, “The report from the United Nations Intergovernmental Panel on Climate Change does not mince words: The evidence is “unequivocal” that these unprecedented extreme weather disasters are tied to carbon emissions from fossil fuel burning and other human activities. This means that yes, dangerous climate change has arrived and at this point it’s simply a matter of how bad we’re willing to let it get.”
Michael E. Mann adds that along with the increase in carbon dioxide (CO2) in the atmosphere, most of the potent greenhouse gas Methane (CH4) appears to be coming from the fossil fuel industry, too. He ays, “the new IPCC report concludes that natural emissions of methane from warming permafrost could become significant if we allow the planet to warm up several more degrees, but at present (and for scenarios that involve substantial efforts to reduce carbon emissions) the dominant source remains us — primarily the extraction of fossil fuels, though agriculture and livestock also contribute to human methane emissions.” Michael E. Mann is also an author; his most recent book is “The New Climate War: The Fight to Take Back our Planet.”
Referring to the IPCC’s New Interactive Atlas, Vox writes “the map tries to strike a balance between the simplicity of, say, Google Maps, and a highly specialized scientific tool.” The IPCC says it may update the user interface to be less “dorky” while Michael E. Mann adds its features might be too limited for the most sophisticated users.
In any case, the IPCC’s New Interactive Atlas is a great tool.
And, the bottom line here is that we have little time to act. In order to prevent an ever-growing list of climate disasters, along with curbing our fossil fuel consumption of coal, oil, and gas, we must recognize and demand that our built environment embrace resilient and regenerative design practices.
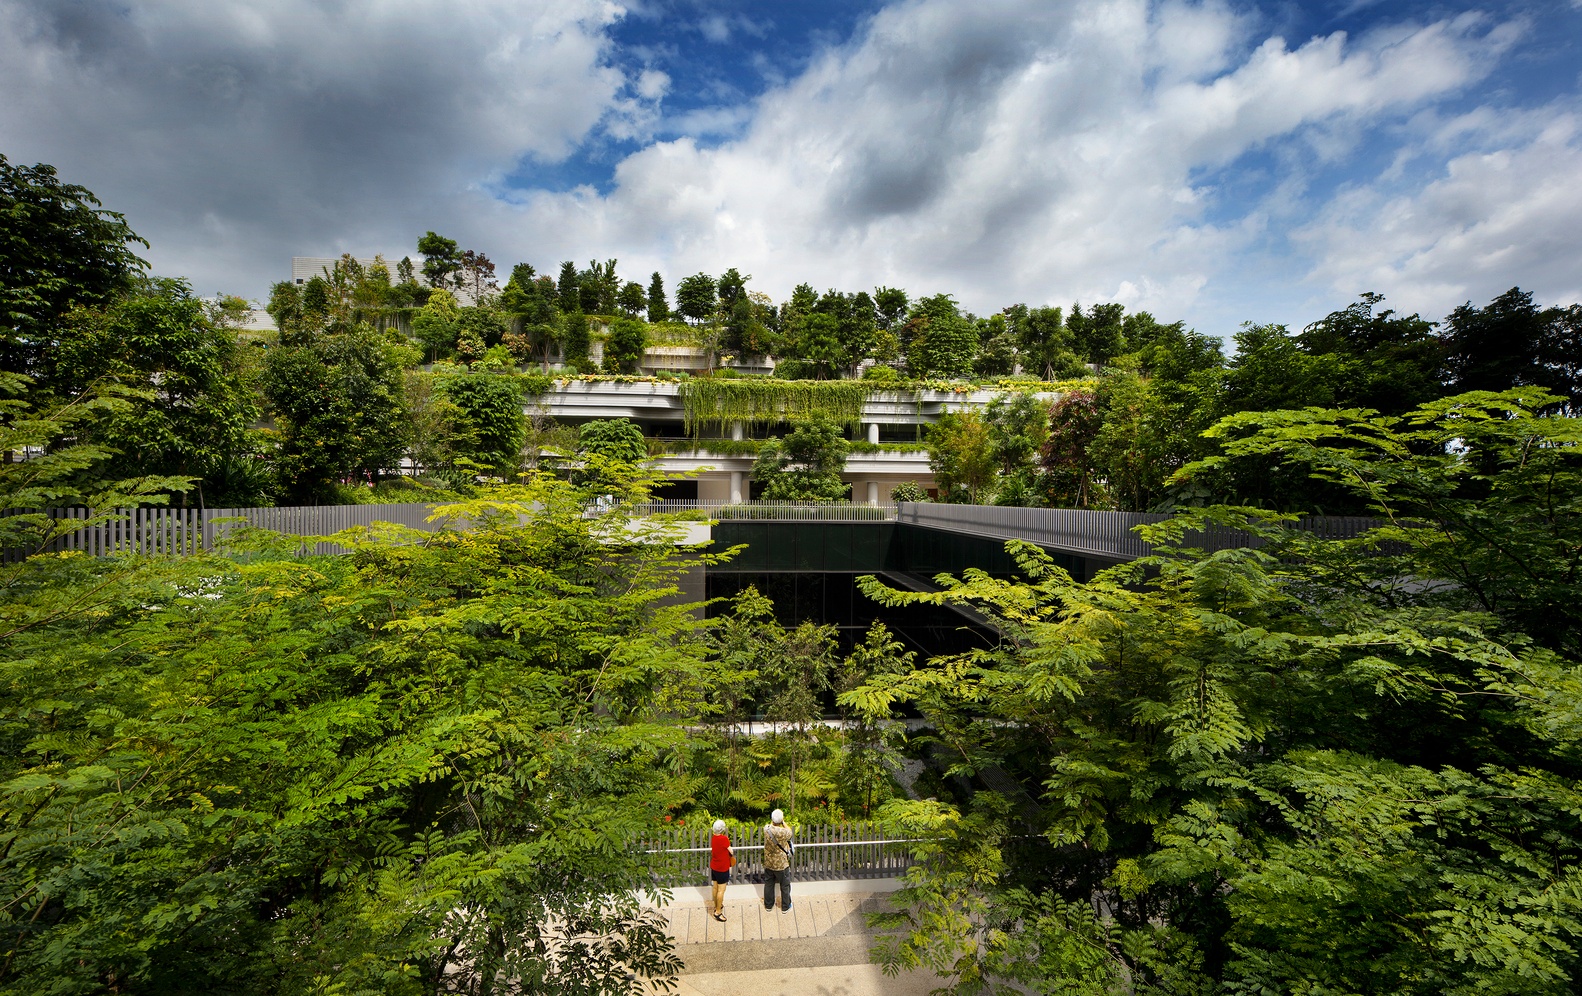
One such living architecture example is the Kampung Admiralty in Singapore. Image: ©Patrick Bingham-Hall
Green infrastructure in general and living architecture as one component of sustainable design will be key if we have any clear, potential hope to bring our planet back from the edge of climate disaster.
Read more: Where extreme weather is getting even worse, in one map