Jet Propulsion Laboratory of SCITECHDAILY writes:
NASA’s Sea Level Change Team has created a sea level projection tool that makes extensive data on future sea level rise from the Intergovernmental Panel on Climate Change (IPCC) easily accessible to the public – and to everyone with a stake in planning for the changes to come.
Its new online visualization tool will enable anyone to see what sea levels will look like anywhere in the world in the decades to come.
NASA released its Sea Level Projection Tool, based on the latest report from the United Nations Intergovernmental Panel on Climate Change (IPCC), also released on August 9, 2021.
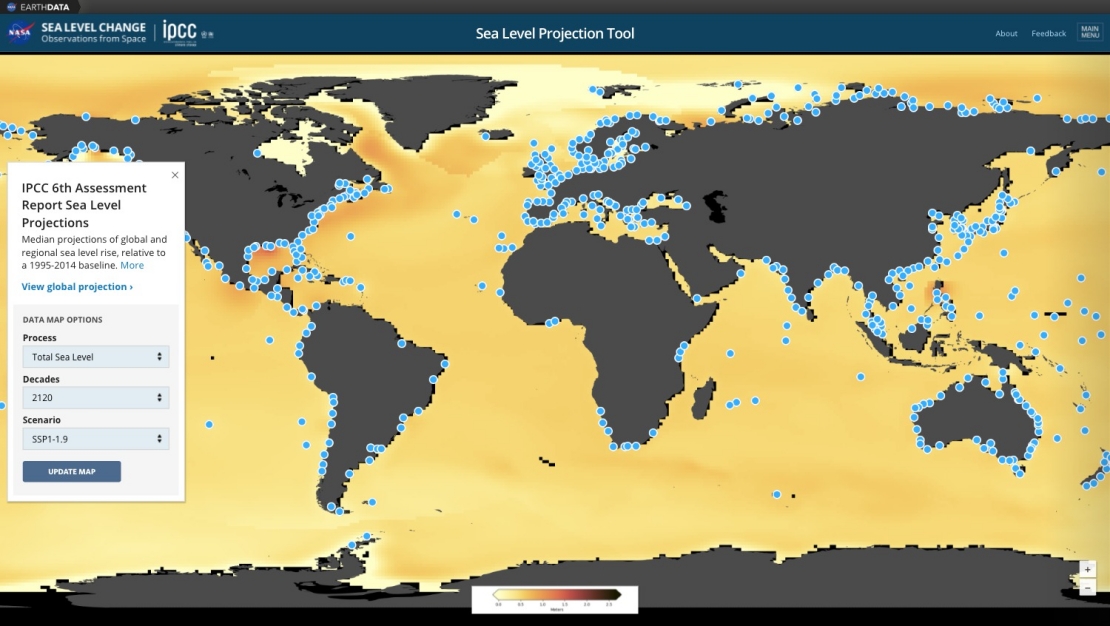
You can pull up the tool’s layers of maps, click anywhere on the global ocean and coastlines, and pick any decade between 2020 and 2150. Hosted on NASA’s Sea Level Portal, the interactive tool will deliver a detailed report for the location based on the projections in the IPCC’s Sixth Assessment Report, which addresses the most updated physical understanding of the climate system and climate change.
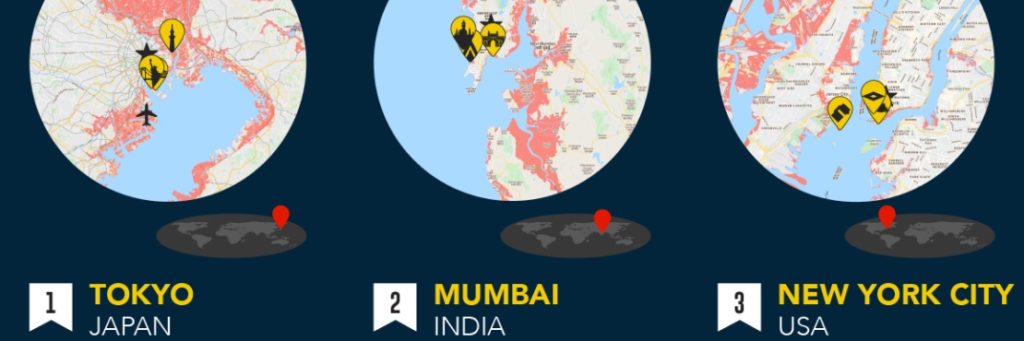
Nadya Vinogradova Shiffer, program scientist and manager at NASA, who directs NASA’s Sea Level Change science team says, “As the first data-delivery partnership between the IPCC and a federal agency, NASA’s new sea level projection tool will help pave the way for future activities that facilitate knowledge sharing, open science, and easy access to the state-of-the-art climate science. This information is critical to increase climate resilience of nations with large coastal populations, infrastructure, and economies that will be impacted by sea level rise.”
“What’s new here is a tool that we are providing to the community, to distribute the latest climate knowledge produced by the IPCC and NASA scientists in an accessible and user-friendly way while maintaining scientific integrity.”– Nadya Vinogradova Shiffer
Along with providing snapshots of rising sea levels in the decades to come, the tool enables users to focus on the effects of different processes that drive sea level rise. Those processes include the melting of ice sheets and glaciers and the extent to which ocean waters shift their circulation patterns or expand as they warm, which can affect the height of the ocean.
IPCC 6th Assessment Report Sea Level Projections are based on median projections of global and regional sea level rise, relative to a 1995-2014 baseline.
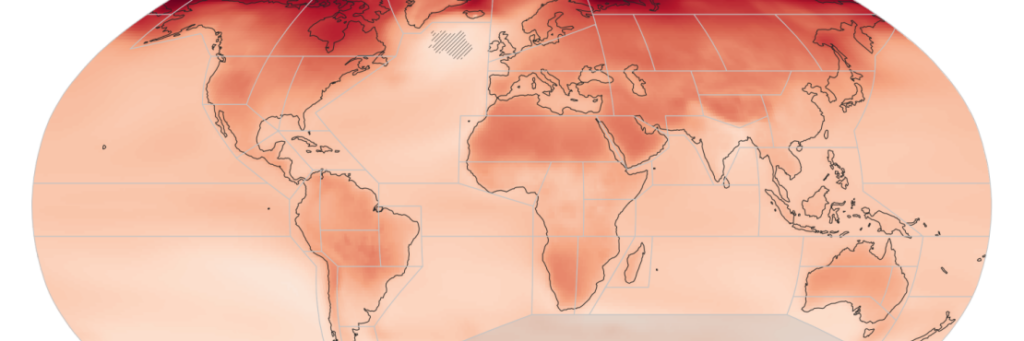
The IPCC has provided global-scale assessments of Earth’s climate every five to seven years since 1988, focusing on changes in temperature, ice cover, greenhouse gas emissions, and sea-level across the planet. Their sea level projections are informed by data gathered by satellites and instruments on the ground, as well as analyses and computer simulations.

Rising seas will exacerbate problems that coastal communities are already dealing with, including high-tide, or “nuisance,” floods. Inundated roadways like this one in Virginia are among the consequences of such floods. Credit: Aileen Devlin, Virginia Sea Grant, CC BY-ND 2.0
“Making sea-level science accessible is our primary goal.” – Carmen Boening, a NASA oceanographer who also heads the agency’s Sea Level Portal
As sea levels continue to rise due to extreme flooding and disturbed weather patterns, the NASA Sea Level Projection Tool is an extremely useful, interactive visualization for city planners, governmental bodies, concerned citizens and sustainable designers committed to creating a more resilient Earth.
See the original article from NASA’s Sea Level Portal.
Read more: Online Visualization Tool from NASA Provide a New Window on Rising Seas